Draw a scaled picture graph and a scaled bar graph to represent a data set with several categories. Solve one- and two-step “how many more” and “how many less” problems using information presented in scaled bar graphs. For example, draw a bar graph in which each square in the bar graph might represent 5 pets.
[divider] [/divider] Students are able to…
- Collect data and draw a picture or bar graph.
- Analyze and explain data from a picture or bar graph.
- Solve “how many more” or “how many less” problems using a bar graph.
[divider] [/divider] Students are able to…because teachers:
- Provide opportunities for students to collect a variety of data.
- Model precise vocabulary and how to organize and display data in a picture or bar graph.
- Pose questions so that students analyze data and solve problems using “how many more” and “how many less”.
[divider] [/divider] Questions to ask students:
- If you were making a bar graph, what important parts would you include?
- Sample answer that indicates understanding: You would need to make a title, scale, scale label, categories and label for the categories. Then you can add the data.
- Why is a key important when analyzing a picture graph?
- Sample answer that indicates understanding: A key lets the reader know the value of each picture on the graph. For example, if the key says each picture equals 3 then I would need to count by threes to find the total in that category.
- Have students use a bar graph to compare 2 categories by asking how many more or how many less is one category than the other.
[divider] [/divider] FSA Notes
Cognitive Complexity Level: 2 – Basic Application of Skills and Concepts
Achievement Level Descriptors:
2- solves one-step problems using a given picture or scaled bar graph (with a scale factor of 1 or 5)
3- creates a scaled picture graph and a scaled bar graph to represent a data set; solves two-step “how many more” and “how many less” problems using information presented in scaled bar graphs
4- completes a scaled picture graph by using addition and subtraction to find missing data values
5- creates a scaled picture graph or a scaled bar graph to represent a data set and determines what the scale factor should be; draws conclusions when analyzing data
Assessment Limits:
The number of data categories are six or fewer.
Items must provide appropriate scale and/or key unless item is assessing that feature.
Only whole number marks may be labeled on number lines.
[divider] [/divider] Additional Resources:
Additional in depth content knowledge
Video: Practice Solving Problems using Scaled Graphs
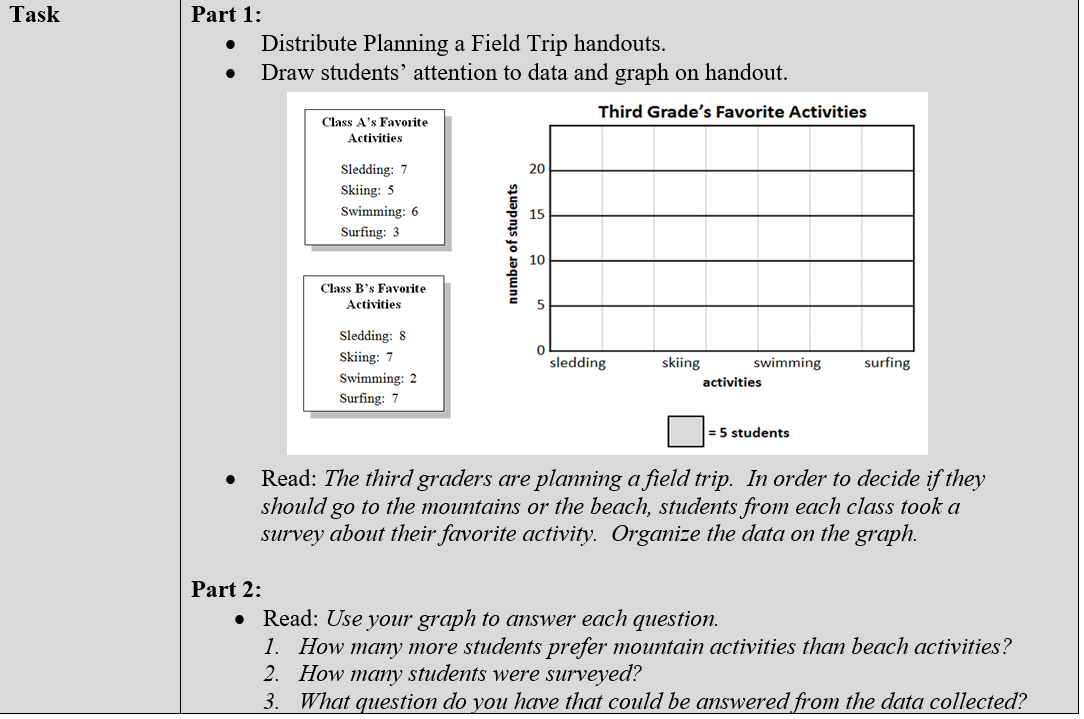
[divider] [/divider] Sample Formative Assessment Task: