Make a line plot to display a data set of measurements in fractions of a unit (1/2, 1/4, 1/8). Solve problems involving addition and subtraction of fractions by using information presented in line plots. For example, from a line plot find and interpret the difference in length between the longest and shortest specimens in an insect collection.
[divider] [/divider]Students are able to…
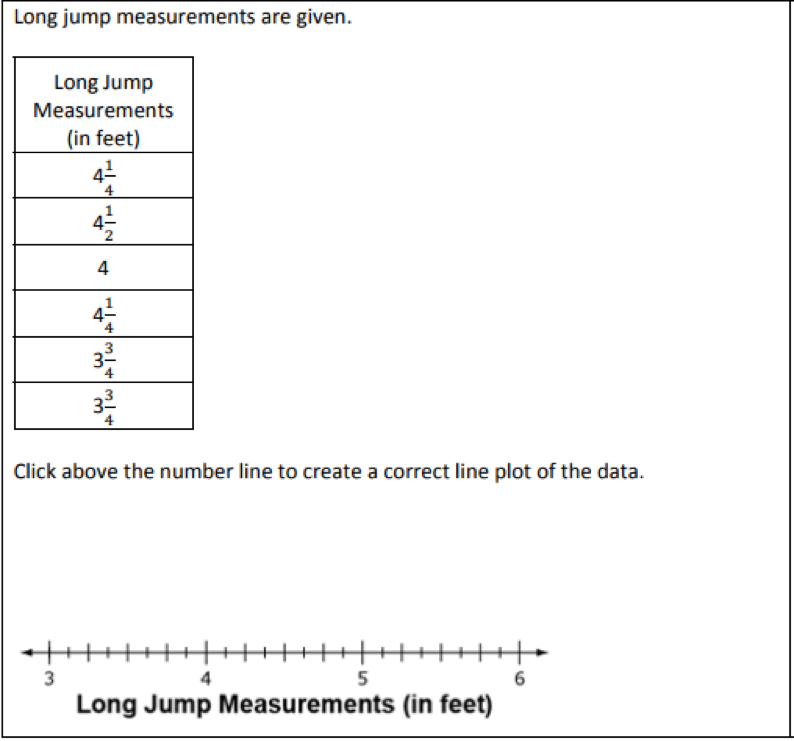
- Create a line plot to represent a set of measurement data, including fractional measures of halves, fourths, and eighths.
- Analyze the line plot and solve addition and subtraction problems about the set of data.
- Recognize when addition or subtraction is needed to solve a problem.
[divider] [/divider]Students are able to…because teachers:
- Provide opportunities for students to create line plots using sets of measurement data that include fractions.
- Ask intentional questions that allow students to connect strategies for adding and subtracting fractions to analyzing the line plots.
- Pose multiple questions that can be solved using the same set of data, allowing students to see the information in different ways.
[divider] [/divider]Questions to ask students:
- What kind of data makes sense to be displayed on a line plot?
- Sample answer that indicates understanding: It must be data where the values are repeated and the range is not too large.
- Ask students to generate a question that can be answered by analyzing data on a given line plot.
- Point to a line plot. Ask students how the line plot is like a number line.
- Sample answer that indicates understanding: Just like on a number line, if the spaces in between the whole numbers aren’t labeled I can count the fractions to see where the “X” is on the line plot.
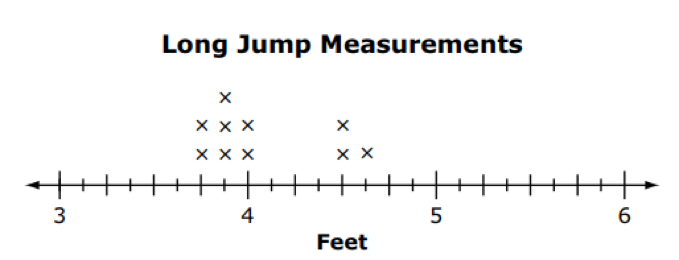
- Point to an “X” on the line plot. Ask students what the “X” represents in the given situation.
- Sample answer that indicates understanding: Each X above the 2 1/4 mark means that we had a pencil that measured measured 2 1/4 inches.
[divider] [/divider]FSA Notes
Cognitive Complexity Level: 2 – Basic Application of Skills and Concepts
Achievement Level Descriptors:
2-makes a line plot to display a data set of measurements in fractions of a unit (1/8, 1/4, 1/2)
3-uses addition and subtraction of fractions to solve problems by using information from a line plot
4-uses addition and subtraction of fractions to solve two-step problems by using information from a line plot
5-uses addition and subtraction of fractions to solve multi-step problems by using information from a line plot; draws conclusions
Assessment Limits:
Measurement units are limited to halves, quarters, and eighths.
Addition and subtraction of fractions is limited to fractions with like denominators.
Limit addition and subtraction to solutions within 1,000.
[divider] [/divider]Additional Resources:
Additional in depth content knowledge
Blog Post: Looking at Line Plots in 4th Grade
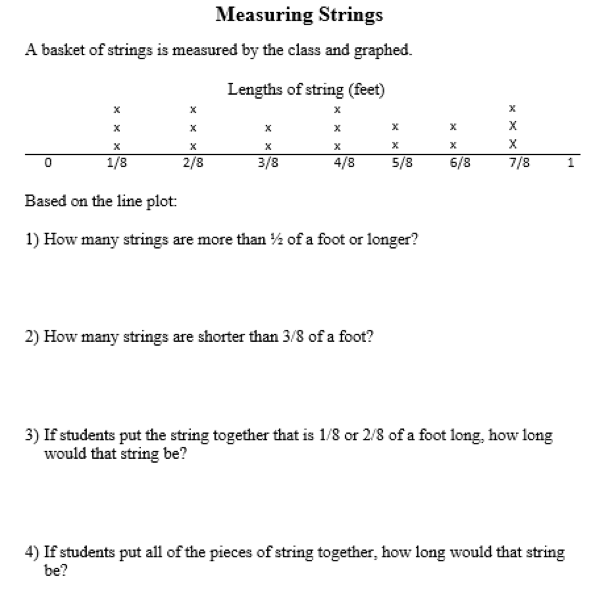
[divider] [/divider]Sample Formative Assessment Tasks:
Resources/Tasks to Support Your Child at Home
Get a can of mixed nuts. Have your child measure various nuts to the nearest 1/8 and then create a line plot with the data.
IXL “Create and Interpret Line Plots with Fractions” – https://goo.gl/v1juEq
Learnzillion “Create Line Plots”-https://goo.gl/gDdHdH
Learnzillion “Construct and Interpret…”-https://goo.gl/bgkvDC