Represent real world and mathematical problems by graphing points in the first quadrant of the coordinate plane, and interpret coordinate values of points in the context of the situation.
[divider] [/divider]
Students are able to…
- Use the first quadrant of a coordinate grid to represent real world problems.
- Analyze the relationship between the values of x-coordinate and the y-coordinate in real world situations.
- Use coordinate grids to travel from one point to another as indicated in a real world situation, such as traveling from a school to a park located on a grid, and describe the distance from the two points.
- Use precise vocabulary and directions when explaining the location of ordered pairs.
Students are able to…because teachers:
- Provide many problems for students to solve involving the relationship between values such as:
- Amount earned for working a certain number of days
- Shoe size compared to height
- Provide problems that show traveling distances for students to determine the best path to travel from one point to the next, such as traveling from school to the park.
- Model use of precise geometry vocabulary (coordinate grid, ordered pairs, axes, x-axis, y-axis, coordinate system, points, first quadrant, horizontal, vertical, intersection of lines, perpendicular, x-coordinate, y-coordinate).
- Construct a floor coordinate grid for more student interaction moving horizontally along x-axis and vertically along y-axis to locate points.
- Provide ample opportunities for students to talk with the teacher and other students about coordinate geometry and make sense of using ordered pairs.
Questions to ask students:
- Use the grid below to explain a path you could take to get from the school to the library.
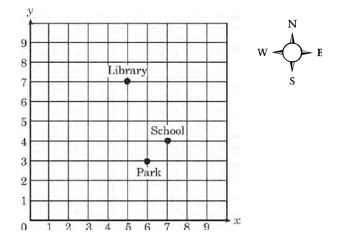
- Sample answer that indicates understanding: Starting at point (7,4) travel two blocks west to point (5,4) then travel north three blocks to reach the library, which is at ordered pair (5,7).
- Sample answer that indicates an incomplete understanding or a misconception: Start at the school and just walk up to the library like this (points to school and drags finger across to the library).
- Explain how you would set up a graph to show the relationship between values in the following situation: Allie earns $6 every hour she sells soda at the ball park. How much money will she have after 2 hours, 4 hours, and 6 hours?
- Sample answer that indicates understanding: My graph would show the hours Allie worked on the y-axis and the money she earned on the x-axis. I would plot each point to show how much money she earned by the end of 2 hours, 4 hours, and 6 hours.
- Sample answer that indicates an incomplete understanding or a misconception: I don’t need to make a graph because I can just multiply or add to find the answer. She earned $36 after 6 hours.
[divider] [/divider]
FSA Notes
Cognitive Complexity Level: Level 2: Basic Application of Skills & Concepts
Achievement Level Descriptors:
Level 2: identifies the key components of the coordinate plane (x-axis, x-coordinate, y-axis, ycoordinate, and origin)
Level 3: identifies, locates, or graphs given points in the first quadrant of the coordinate plane; interprets coordinate values of points in the first quadrant in context
Level 4: locates or graphs a point using directions from another point in the first quadrant
Level 5: describes the direction from one point to another point; names or graphs the point that would complete a specified, two-dimensional geometric shape in the first quadrant
Assessment Limits:
- Points may only contain positive, whole number ordered pairs.
- Mathematical and real‐world problems must have axes scaled to whole numbers (not letters).
Context: Allowable
[divider] [/divider]
Additional Resources:
Additional in depth content knowledge
[divider] [/divider]
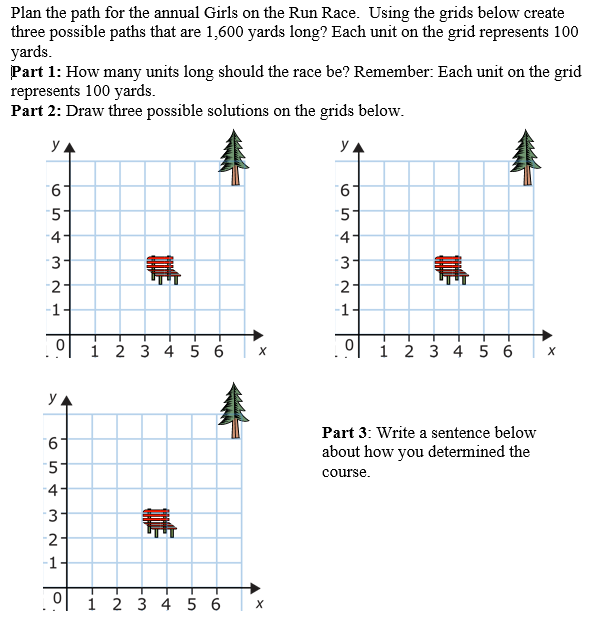
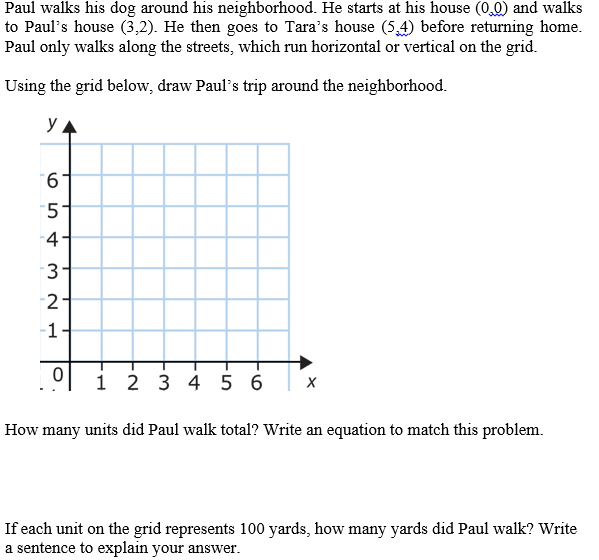
Sample Formative Assessment Tasks:
[divider] [/divider]