MAFS.2.MD.4.9 Generate measurement data by measuring lengths of several objects to the nearest whole unit, or by making repeated measurements of the same object. Show the measurements by making a line plot, where the horizontal scale is marked off in whole-number units.
Cognitive Complexity Level: 1-Recall
[divider] [/divider] Students are able to…
- Measure and record the lengths of several objects to the nearest whole-number
- Create a line plot with a horizontal scale to display the data of the objects they measured
- Record length measurements on a line plot
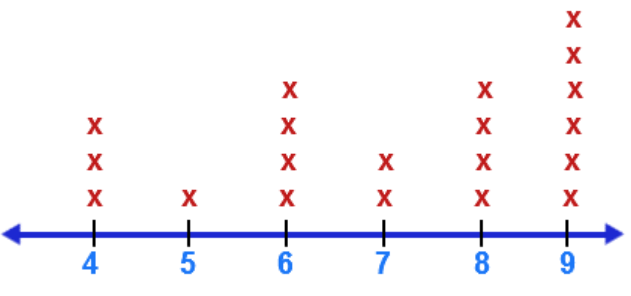
- Example of a line plot:
[divider] [/divider] Students are able to…because teachers:
- Use the concept of measuring to graphically display data a set of data on a number line called a line plot.
- Include values associated with a line plot, which include: the measurements and the frequency of those measurements.
[divider] [/divider] Questions to ask students:
- Ask: What does the X on the line plot represent?
- Sample answer that indicates understanding: Student is able to correctly describe what each X represents (each caterpillar/string/etc.)
- Ask: What do the numbers on your line plot represent?
- Sample answer that indicates understanding: Student is able to describe that the number represents inches, centimeters, some of type of length.
- Ask: What do you notice about the data?
- Sample answer that indicates understanding: Students is able to explain the data using mathematical language and connections to the line plot labels. (Example: I noticed the caterpillars with the length of 5 inches were selected the most. I noticed there are 3 more caterpillars with a length of 5 inches than 2 inches).
[divider] [/divider] Additional Resources:
Additional in depth content knowledge
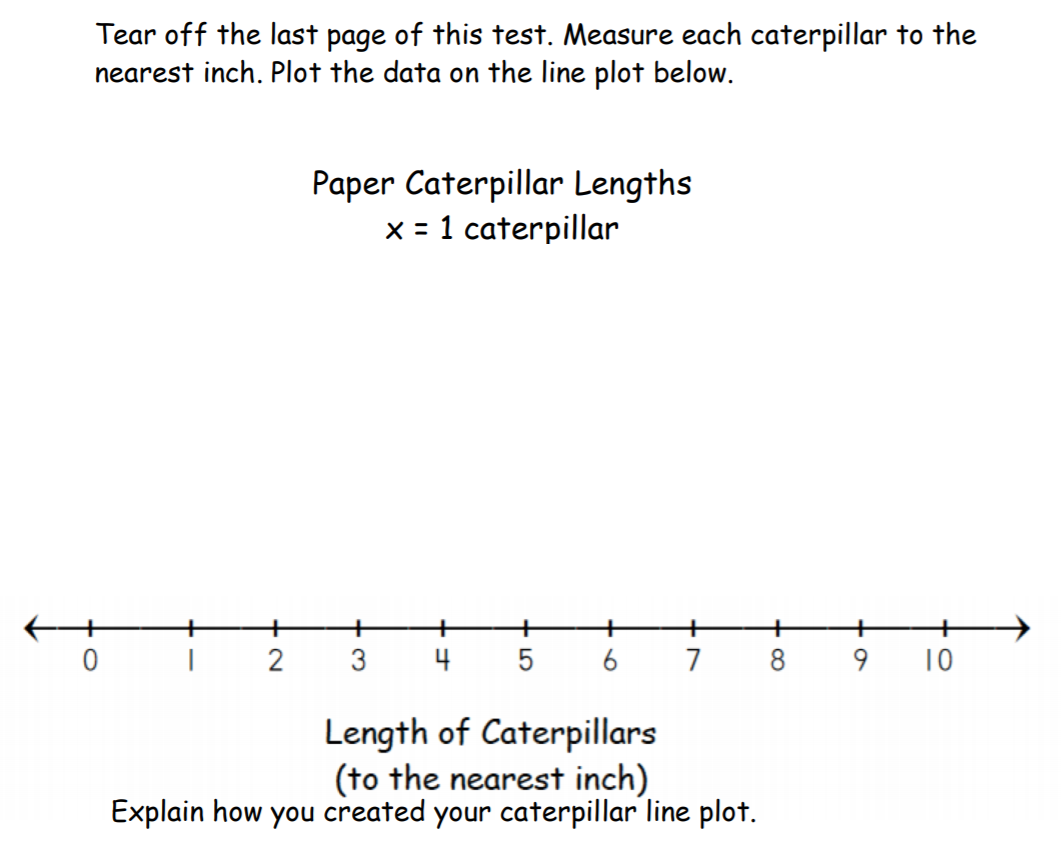
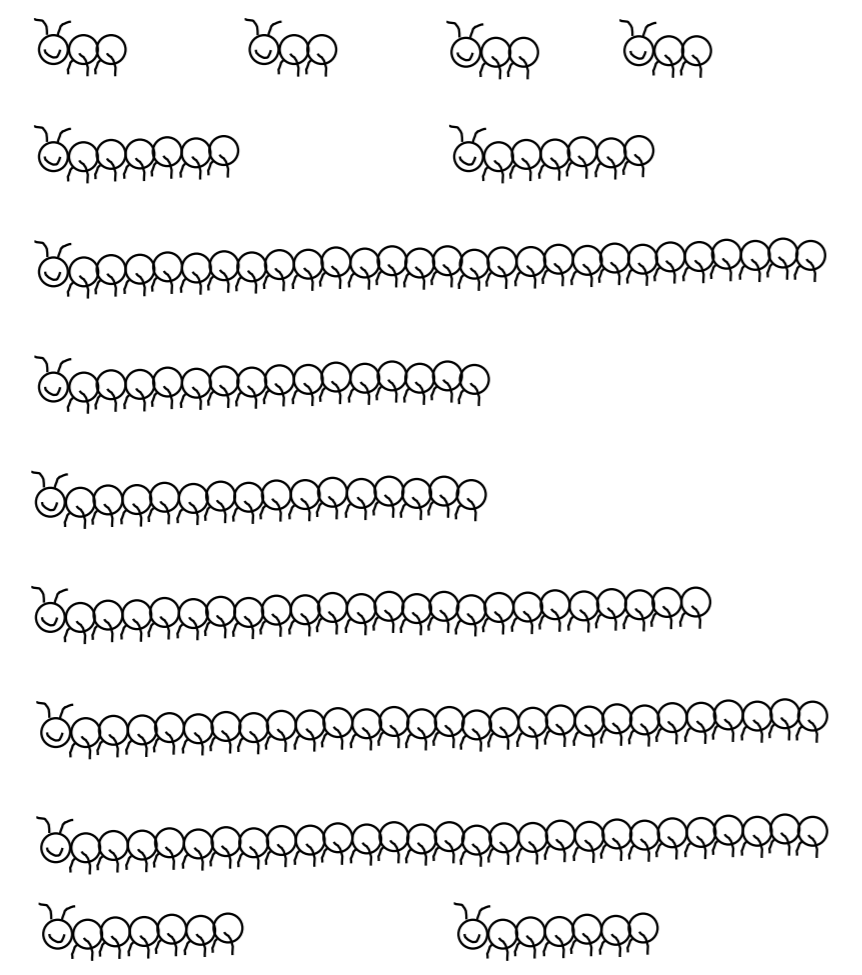
[divider] [/divider] Sample Formative Assessment Tasks:
[divider] [/divider] Resources/Tasks to Support Your Child at Home:
- Have your child measure different lengths of string, pieces of paper or office supplies at your home. Have them display the measurement data in a line plot. Then have them describe what they notice on the line plot.
- You could extend to ask story problems involving the measurement data on the line plot.
- Khan Academy: Introduction into Line Plots
- Youtube: Understand Measurement Data Shown in Line Plots