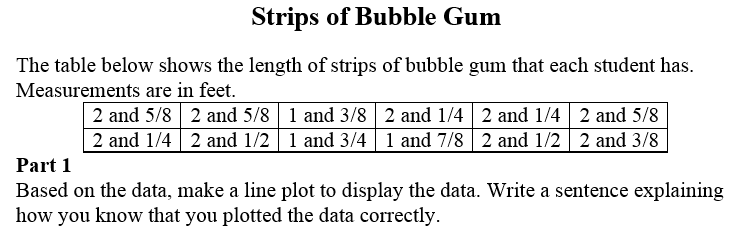
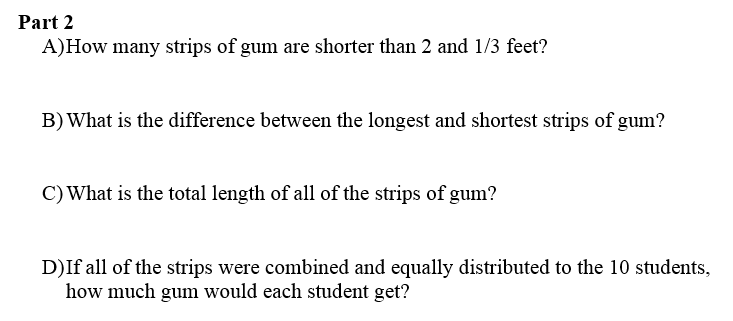
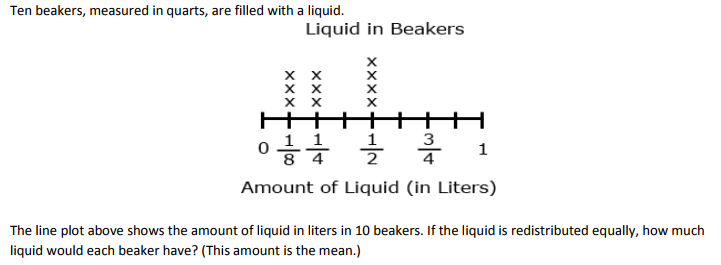
Make a line plot to display a data set of measurements in fractions of a unit (1/2, 1/4, 1/8). Use operations on fractions for this grade to solve problems involving information presented in line plots. For example, given different measurements of liquid in identical beakers, find the amount of liquid each beaker would contain if the total amount in all the beakers were redistributed equally.
[divider] [/divider]
Students are able to…
- Measure objects to one-eighth of a unit regarding the object’s length, mass, and liquid volume.
- Gather data and construct a line plot displaying the data.
- Analyze and interpret data in a line plot.
- Solve problems using operations on fractions from information presented in a line plot.
- Use tools such as rulers, beakers, balance scales, and graduated cylinders.
- Use precise mathematical vocabulary when working with line plots and fractional measurements.
Students are able to…because teachers:
- Plan opportunities for students to measure objects to find their length, mass, and/or liquid volume.
- Connect prior learning about line plots from previous grade levels with the need to display precise data gathered on a line plot.
- Plan hands-on lessons for students to measure liquid volume in ten beakers filled with water to given fractional amounts. Students will then use the data to construct a line plot and determine how much liquid each beaker would have if the liquid is redistributed equally.
- Provide ample opportunities for students to experience measuring length, liquid volume, and mass and for students to record data by displaying measurements on line plots.
Questions to ask students:
- What operation(s) would you use to find out how much liquid is in each beaker with the liquid is redistributed equally?
- Sample answer that indicates understanding: I would add each amount from the 10 beakers and get a sum then divide that sum by 10.
- Sample answer that indicates an incomplete understanding or a misconception: I would add the fractions from my line plot.
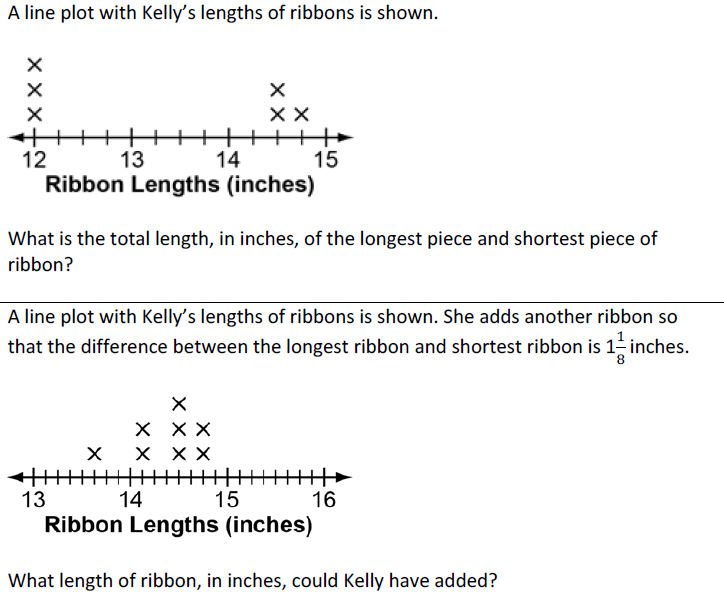
- Pointing to the X circled on the line plot, ask what does this represent? How do you know?
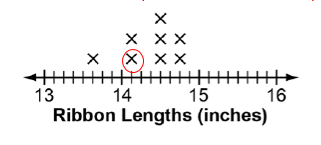
- Sample answer that indicates understanding: The X represents the length of one of ribbons that was 14 and 1/8. There were two ribbons with a length of 14 and 1/8 inches. I know the X is at 14 and 1/8 because it is between 14 and 15 inches and each tick mark represents one-eighth of an inch. There are 8 equal spaces between 14 and 15 inches.
- Sample answer that indicates an incomplete understanding or a misconception: The X is at 14 ¼ because it’s a little more than 14.
[divider] [/divider]
FSA Notes
Cognitive Complexity Level: Level 2: Basic Application of Skills & Concepts
Achievement Level Descriptors:
Level 2: makes a line plot to display a data set of measurements in fractions of a unit (1/2, 1/4, 1/8); solves addition and subtraction problems using the data
Level 3: uses a line plot to solve problems that require grade appropriate fraction operations
Level 4: uses a line plot to solve multistep word problems
Level 5: Intentionally left blank
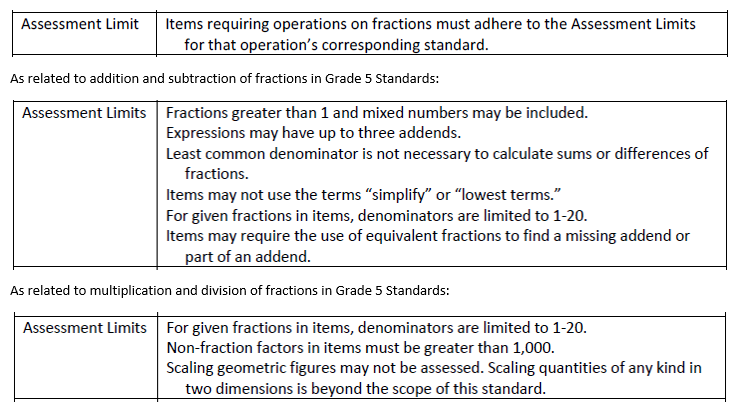
Assessment Limits:
[divider] [/divider]
Additional Resources:
Additional in depth content knowledge
Videos:
Solving multi-step problems using a line plot
Construct and Interpret Line Plots
[divider] [/divider]
Sample Formative Assessment Tasks:
[divider] [/divider]
[divider] [/divider]