Generate measurement data by measuring lengths using rulers marked with halves and fourths of an inch. Show the data by making a line plot, where the horizontal scale is marked off in appropriate units— whole numbers, halves, or quarters.
[divider] [/divider] Students are able to…
- Measure objects to the nearest whole, half, and quarter inch.
- Collect measurements and create a line plot.
[divider] [/divider] Students are able to…because teachers:
- Provide opportunities for the students to measure objects to the nearest whole, half, and quarter inch.
- Model using precise vocabulary and creating a line plot by plotting the data that students collected.
- Ask questions to allow students to talk about the data and the components of a line plot.
[divider] [/divider] Questions to ask students:
- How would you record the data on a line plot?
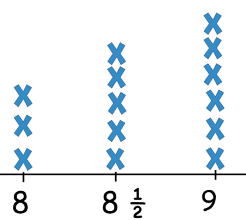
- Sample answer that indicates understanding: Each piece of data would be represented by an X on the line plot. I would put an X for each item that I measured and if there is more than one item that is the same length than I would put the X’s above each other like this:
- Choose 2 measurements on a line plot and ask the student to compare the data.
- Sample answer that indicates understanding: Student should compare data using vocabulary such as more than, less than, double, and half. For example, there are 2 less items that measured 8 inches than 8 ½ inches; there are double the number of items that measured 9 inches than 8 inches.
- How many objects in total were measured? How many objects measured more than or less than a given length?
- Sample answer that indicates understanding: Student will know to count all of the X’s or count the X’s to the left or right of the measurement given.
- Ask the students to measure an item to the nearest half and fourth.
- Sample answer that indicates an incomplete understanding or a misconception: Student does not line up the item correctly by starting at the zero or cannot determine the length to the nearest half or fourth.
[divider] [/divider] FSA Notes
Cognitive Complexity Level: 2 – Basic Application of Skills and Concepts
Achievement Level Descriptors:
2- measures lengths to the nearest half and whole number
3- generates measurement data by measuring lengths to the nearest half- and quarter-inch; shows the data by making a line plot, where the horizontal scale is marked in appropriate units (whole number, halves, or quarters)
4- creates the horizontal scale in appropriate units (whole number, halves, or quarters)
5- [intentionally left blank]
Assessment Limits:
Standard rulers may not be used; only special rulers that are marked off in halves or quarters are allowed.
Measurements are limited to inches.
[divider] [/divider] Additional Resources:
Additional in depth content knowledge
Blog Posts:
Connecting Academics and Parents: Measurement 3rd Grade
Measuring Length with Fractions
LearnZillion Videos:
Construct and Interpret a Line Plot
Measuring Objects Using Whole, Half, and Quarter Inches
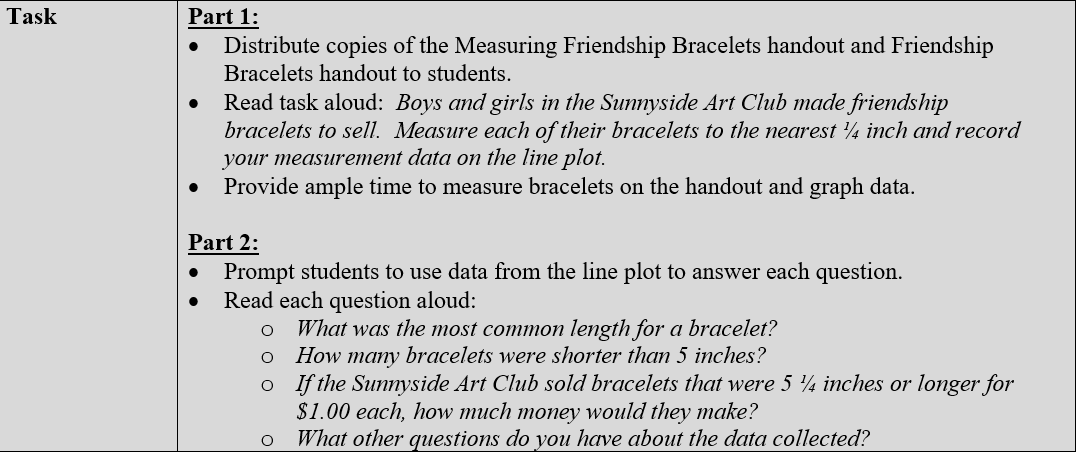
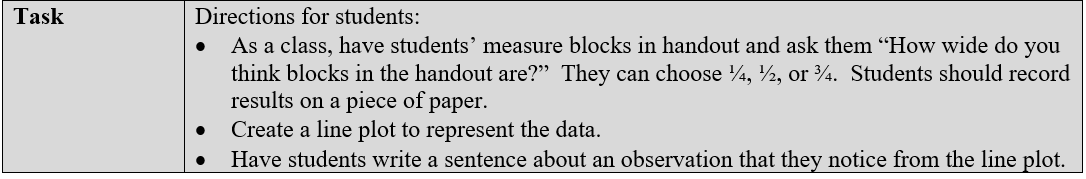
[divider] [/divider] Sample Formative Assessment Task:
[divider] [/divider] Resources/Tasks to Help your Child at Home:
Have your child measure various objects in your home to the nearest inch, half and quarter-inch. Challenge your child to find lengths of objects when starting at a value other than zero, to show that the length of the object stays the same.
Your child can create a frequency table of the lengths of various items that they measure around the house. This data can then be displayed on a line plot. Ask questions about the line plot, such as:
- What length has the greatest number of items?
- How many total items are displayed on the line plot?
- How many items were ____ inches or longer?
LearnZillion Videos: